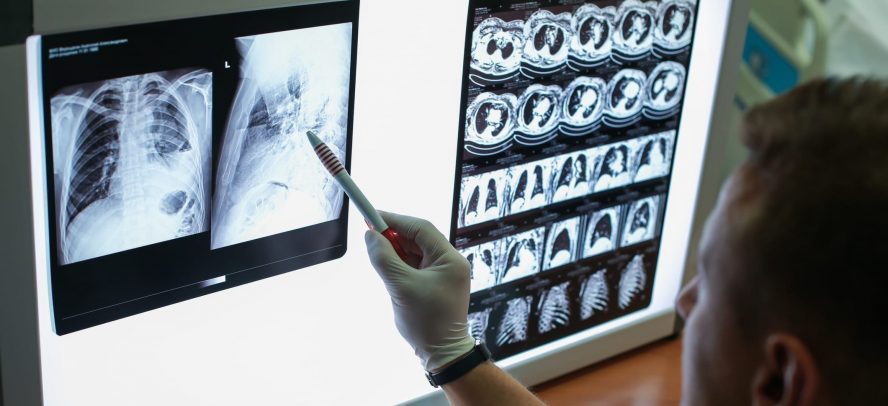
CAD4COVID-XRay can identify characteristics of COVID-19 on chest radiographs with performance comparable to six readers
The study was approved by Institutional Review Boards of Jeroen Bosch Hospital, Bernhoven Hospital and Radboud University Medical Center
The diagnostic test for COVID-19 infection is a reverse transcription polymerase chain reaction (RT-PCR) test. However, there has been a severe shortage of test-kits worldwide and furthermore, laboratories in most countries have struggled to process the available tests within a reasonable time-frame. While efforts to increase the capacity for RT-PCR testing have been underway, healthcare workers attempting to triage symptomatic patients have turned to imaging in the form of chest radiography or CT. Imaging is part of a triage to assess pulmonary health and route patients to the appropriate parts of the healthcare system. There are several strategies and flow charts in diagnosing and ruling out COVID-19 and chest radiography and / or CT have been widely used as part of the initial screening process [2] [3] [4] [5].
While many countries have experienced difficulties in allocating scarce resources throughout the COVID-19 pandemic, countries such as those in the developing world with economic, infrastructural, governmental and healthcare problems (‘resource-constrained’) are particularly at risk. In resource-constrained settings, the COVID-19 pandemic could have consequences far more severe than we have already seen in industrialised countries. The WHO reports that as of April 15 outbreaks were confirmed in 45 African countries, describing 10,759 cases with 520 deaths [6]. Given the lack of access to medical care and the low availability of RT-PCR tests across the African continent, it is likely that the true numbers are much higher. The strategy in these regions must focus heavily on detection and reduction of transmission through effective isolation and quarantine processes.
Chest radiography (CXR) is a fast and relatively inexpensive imaging modality which is available in many resource-constrained healthcare settings. Unfortunately, there is a severe shortage of radiological expertise in these regions to allow for precise interpretation of such images [7]. An AI system may be a helpful tool as an adjunct to radiologists or, in the common case that radiological expertise is not available, for the medical team [8] [9]. Previous work in the related task of tuberculosis (TB) detection on CXR [10] [11] [12] has demonstrated that software can perform at the level of an expert radiologist at the task of TB identification. In this study we evaluate the performance of an available [13] artificial intelligence (AI) system for the detection of COVID-19 pneumonia on CXR.
Materials and Methods
Data
This study was approved by the Institutional Review Boards of Jeroen Bosch Hospital (‘s Hertogenbosch, The Netherlands), Bernhoven Hospital (Uden, The Netherlands) and Radboud University Medical Center (Nijmegen, The Netherlands). Informed written consent was waived, and data collection and storage were carried out in accordance with local guidelines.
Artificial intelligence system for X-ray interpretation
CAD4COVID-XRay is a deep-learning based AI system for the detection of COVID-19 characteristics on frontal chest radiographs. The software was developed by Thirona (Nijmegen, The Netherlands) and provided for this study. Some authors are employees (RP, AM, JM) or consultant (BvG) of Thirona, the other authors had control of inclusion of any data and information in this study. CAD4COVID-Xray is based on the CAD4TB v6 software [10], which is a commercial deep-learning system for the detection of tuberculosis on chest radiographs. As pre-processing steps, the system uses image normalisation [14] and lung segmentation using a U-net [15]. This is followed by patch-based analysis using a convolutional neural network and an image level classification using an ensemble of networks.
The system was re-trained, firstly on a pneumonia dataset [16], acquired prior to the COVID-19 outbreak. This data is publicly available and has been fully anonymised. It is known to come from a single centre but details of the X-ray system(s) are not available. This dataset includes 22,184 images of which 7,851 were labelled normal and 5,012 were labelled as pneumonia. The remainder had other abnormalities inconsistent with pneumonia. A validation set of 1500 images (500 per label, equally split between PA and AP images) was held out and used to measure performance during the training process. The purpose of re-training using this data was to make the system sensitive and specific to pneumonia in general, since large numbers of COVID-19 images are difficult to acquire at present. To fine-tune the system for detection of COVID-19 specifically, an additional training set of anonymised CXR images was acquired from Bernhoven Hospital comprising 416 images from RT-PCR positive subjects and 191 images from RT-PCR negative subjects. These were combined with 96 COVID-19 images from other institutes and public sources and 291 images from Radboud University Medical Center from the pre-COVID-19 era (used to increase numbers of negative samples). This dataset of 994 images was used to re-train the system a final time, holding 40 images out for validation (all from Bernhoven Hospital, equally split between positive and negative and PA/AP). This dataset comprised all RT-PCR confirmed data available to us (excluding the test set) with the addition of negative data to balance the class sizes. The system takes approximately 15 seconds to analyse an image on a standard PC.
The test set was selected from CXR images from the Jeroen Bosch Hospital (’s-Hertogenbosch, The Netherlands) acquired from COVID-19 suspected subjects presenting at the emergency department with respiratory symptoms between March 4 and April 6, 2020. All patients underwent laboratory measurements, CXR imaging and RT-PCR testing (Thermo Fischer Scientific, Bleiswijk, The Netherlands).
The imaging data included both standard radiographs (posteroanterior (PA) and lateral projection) of the chest (Digital Diagnost, Philips, Eindhoven, The Netherlands), of which only the PA images were selected, as well as the anteroposterior (AP) projections obtained with a mobile system (Mobile Diagnost, Philips, Eindhoven, The Netherlands). Of all 827 frontal images, a single image per patient with a RT-PCR result available was selected (n = 555).
Where multiple CXR images were available for a patient the best quality image, acquired for diagnostic purposes was selected. This selection contained only one image of a minor (age 4), which was included since the AI software is intended to work on minors age 4 and upwards. In total 87 images that did not display the entire lungs or which were acquired for non-diagnostic purposes such as checking tube positioning were excluded. The patient characteristics of the remaining 468 images are detailed in Table 1.
Table 1: Properties of training, validation and test sets. Age, gender and orientation are not known for all training cases due to anonymization of the datasets at their source.

Multi-reader study
The test set was scored by six readers (AK: Chest radiologist with five years of experience, MK: Chest radiologist with 20 years of experience, CSP: Chest radiologist with more than 20 years of experience, MR: Radiologist with 24 years of experience, ETS: Chest radiologist with more than 30 years of experience, SS: Chest radiologist with six years of experience). Readers assigned each image one of the following categories.
(0) Normal: No finding
(1) Abnormal but no lung opacity consistent with pneumonia
(2) Lung Opacity consistent with pneumonia (unlikely COVID-19)
(3) Lung Opacity consistent with pneumonia (consistent with COVID-19)
Readers could also mark images as unreadable. All readers assessed the images independently, fully blinded to other reader opinions, clinical information and RT-PCR results.
Reader consensus was used to evaluate the AI system against a radiological reference standard and to provide an overview of the pulmonary abnormalities of the test set from a radiological viewpoint. To create a consensus among readers, the most frequently chosen score for an image was selected. Where there was a tie of frequencies the higher score was selected.
Statistical methods
Performance of the AI system was assessed by generation of a receiver operating characteristic (ROC) curve from the AI system scores. Area under the ROC curve (AUC) is reported. Similarly, reader performance was evaluated by thresholding at different score levels to generate ROC points.
Confidence intervals (95 per cent) on the ROC curve and on the reader sensitivity / specificity points were generated by bootstrapping [17].
For each reader sensitivity value, the corresponding specificity and the specificity of the AI system at that sensitivity setting are computed. A statistically significant difference is determined by means of the McNemar test. The resulting p-values are reported in each case (p < 0.05 was considered significant).
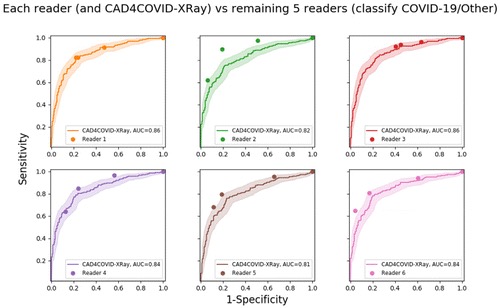
Additionally, the performance of the AI system and each reader was measured against a consensus radiological reference standard of the remaining five readers. For creation of an ROC curve, the reference standard is required to be binary. This was achieved by setting the reference standard at 1 for images rated consistent with COVID-19 and at 0 for images with any other consensus-score.
Positive and negative predictive values (PPV and NPV) were calculated for all readers and for the consensus reading using a reference standard of RT-PCR results. We defined three operating points for The AI system at sensitivities of 60 per cent, 75 per cent and 85 per cent, respectively, and computed the same metrics.
Results
Any image considered unreadable by any of the readers was excluded from analysis. Of the 468 images, 454 were successfully read by all six readers. Readers were not required to specify reasons for rejection of images, however, where comments were provided these related to poor image quality caused by weak inspiration or incorrect patient positioning. To provide an overview of the content of the test set from a radiological point of view, the consensus of all six readers was established on the remaining 454 images. This consensus labels 117 cases as normal (0), 94 cases as containing abnormalities other than pneumonia (1), 26 cases as pneumonia not consistent with COVID-19 (2) and 217 cases as consistent with COVID-19 pneumonia (3). These numbers indicate the diversity of pathology in the test set.
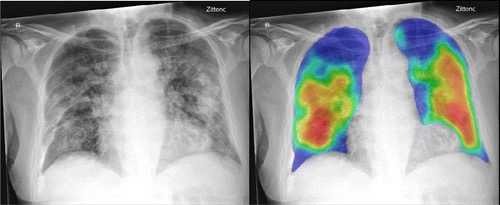
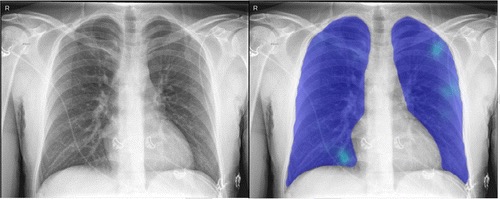
The AI system was applied successfully to all 454 cases. Figure 1 shows examples of the AI system heat maps of a RT-PCR positive patient and a RT-PCR negative patient.
The ROC results for all six readers and the AI system using RT-PCR results as the reference standard are depicted in Figure 2. The AI system achieved an AUC of 0.81. In most regions of the ROC curve the system performed better than, or at the same level as, the readers. Clusters of points from radiological readers are seen at sensitivities of approximately 60 per cent, 75 per cent and 85 per cent. While the ROC curve indicates specificity at all sensitivity levels, we identified three particular operating points in line with these sensitivities where reader points are clustered. At 60 per cent sensitivity, the AI system obtains a specificity of 85 per cent (95 per cent CI [79-90 per cent]), at 75 per cent sensitivity the specificity is 78 per cent (95 per cent CI [66-83 per cent]), while at a setting of 85 per cent sensitivity the specificity decreases to 61 per cent (95 per cent CI [48-72 per cent]).
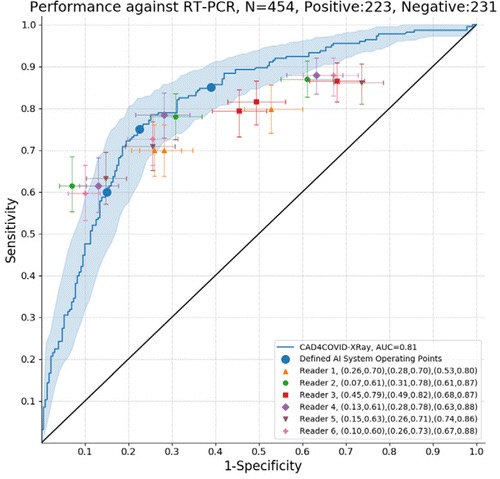
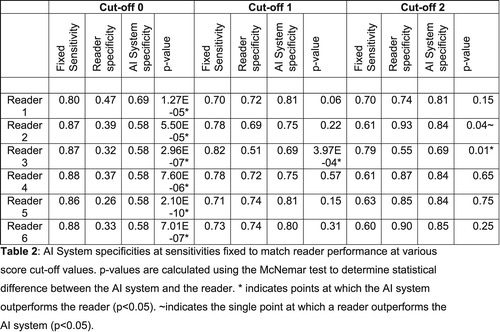
Table 2 compares the AI system and reader performance at sensitivity values fixed for the readers’ ROC points. The system outperformed all readers at their highest sensitivity for detection of COVID-19 characteristics. At intermediate sensitivity settings, the system statistically outperformed reader three, while no reader was statistically better than the system. At the lowest sensitivity setting, only reader two could outperform the system (p = 0.04), while the system continued to outperform reader three (p = 0.01).
Results of the analysis of PPV and NPV are shown in Table 3. The AI operating points were selected at sensitivities of 60 per cent, 75 per cent and 85 per cent coinciding with the observed clusters of points from the radiological readers at these locations in the ROC curve (Figure 1). At low and intermediate sensitivity operating points AI has a similar performance to the readers (using the related cut-off point for reader scores) in terms of PPV and NPV. On the other hand, at high sensitivity AI outperformed the six readers both in terms of NPV and PPV.
Table 3: Positive Predictive Values (PPV) and Negative Predictive Values (NPV) for each reader, for the artificial intelligence (AI) system, and for the consensus reading. The three possible cut-off points for reader scores are used while three operating points for the AI system are defined at 60 per cent, 75 per cent and 85 per cent. These correspond to clusters of radiological reader points on the ROC curve. Reference standard is RT-PCR results.

Discussion
In this study, we evaluated the performance of an AI system to detect abnormalities related to COVID-19 chest radiographs on an independent test set and compared it to radiologist readings. The external test set used to evaluate the AI system was from a hospital system different from that used to train and validate the AI system. The exams in the test set were representative of the CXR studies obtained during the peak of the COVID-19 epidemic in The Netherlands and were not selected to exclude other abnormalities. Based on the reader consensus, 120 of these images had abnormalities not consistent with COVID-19, 117 were completely normal and the remaining 217 had abnormalities consistent with COVID-19. The AI system performance for detection of COVID-19 was compared with six independent readers and was found to be comparable or even better at high sensitivity operating points. In the clinical setting, the PPV and NPV of AI may be considered more useful, indicating the likelihood of COVID-19 given a positive or negative result from the system [18]. Our results show that at a fixed operating point (sensitivity of 75 per cent) the AI system has a PPV of 77 per cent and NPV of 76 per cent. This result is comparable to performance using the consensus of all six readers (PPV=72 per cent, NPV=78 per cent).
The results achieved by the AI system compared to radiologist readings are noteworthy given the fact that the presentation of COVID-19 pneumonia on CXR can be highly variable ranging from peripheral opacifications only to diffuse opacifications making differentiation from other diseases challenging [5] [19] [20]. Chest radiographs may be normal initially or in mild disease, however Wong et al. showed that of all patients with COVID-19 requiring hospitalisation, 69 per cent had an abnormal chest radiograph at admission [20]. During hospitalisation, 80 per cent showed chest X-ray abnormalities, which were most extensive 10-12 days after symptom onset [20]. Frequent findings related to COVID-19 on chest X-ray are ground glass densities, diffuse air space disease, bilateral lower lobe consolidations and peripheral air space opacities, predominantly dorso-basal in both lungs [5] [20]. Pleural effusions, lung cavitation and pneumothorax may occur but are relatively rare [21].
To improve the performance of the AI system for COVID-19 a larger training set of radiographs is needed. Improvements may also be obtained by combining radiography analysis with clinical and laboratory findings.
In future work, the role of AI in management or triage of patients in the COVID-19 pandemic should be investigated, taking all related patient information and the experience level of the healthcare professionals interpreting the radiographs into account.
Our study has several limitations. First, the test set comes from a single institution, which may not be representative of data from other centres. Second, the number of COVID-19 (RT-PCR positive) images in the training set of the system was relatively small (512 images), relative to the number of labelled pneumonia (non-COVID-19) images (5,012) and the system evaluated only frontal X-rays. Also, the test set was not ideally suited to test the ability of the AI system to differentiate COVID-19 from non-COVID-19 pneumonia because the test set had been obtained during the peak of the pandemic and the number of non-viral pneumonia cases (according to the reader consensus) was relatively small. We used the RT-PCR as the reference standard, but RT-PCR has limited sensitivity for COVID-19 infection (71 per cent) [22]. This suggests that there may be subjects in our test set with indications of COVID-19 on chest radiography but with a negative RT-PCR result.
In summary, we evaluated an AI system for detection of COVID-19 characteristics on frontal chest radiographs. The AI system was comparable to six independent readers. The tool is made available pro bono on the manufacturer’s website, to be of benefit in public health surveillance and response systems worldwide and may provide support for radiologists and clinicians in chest radiograph assessment as part of a COVID-19 triage process.
References:
1. Worldometers Corona Virus,” 2020. [Online]. Available: https://www.wordlometers.info/coronavirus/. Google Scholar
2. W. Yang, A. Sirajuddin, X. Zhang, G. Liu, Z. Teng, S. Zhao, M. Lu, “The role of imaging in 2019 novel coronavirus pneumonia (COVID-19),” European Radiology, vol. April 15, pp. 1-9, 2020. Google Scholar
3. G. D. Rubin, C. J. Ryerson, L. B. Haramati, N. Sverzellati, J. P. Kanne, S. Raoof, N. W. Schluger, A. Volpi, J.-J. Yim, I. B. K. Martin, D. J. Anderson, C. Kong, T. Altes, A. Bush et al, “The Role of Chest Imaging in Patient Management during the COVID-19 Pandemic: A Multinational Consensus Statement from the Fleischner Society,” Radiology, vol. Apr 7, 2020. Google Scholar
4. M. P. Cheng, J. Papenburg, M. Desjardins, S. Kanjila, C. Quach, M. Libman, S. Dittrich, C. P. Yansouni, “Diagnostic Testing for Severe Acute Respiratory Syndrome–Related Coronavirus-2: A Narrative Review,” Annals of Internal Medicine, vol. 13 Apr, 2020. Google Scholar
5. A. Jacobi, M. Chung, A. Bernheim, C. Eber, “Portable chest X-ray in coronavirus disease-19 (COVID-19): A pictorial review,” Clinical Imaging, vol. 64, pp. 35-42, 2020. Crossref, Medline, Google Scholar
6. World Health Organisation, situation reports on COVID-19 outbreak,” 15 April 2020. [Online]. Available: https://apps.who.int/iris/bitstream/handle/10665/331763/SITREP_COVID-19_WHOAFRO_20200415-eng.pdf. Google Scholar
7. D. J. Mollura, P. M. Lungren, Radiology in Global Health, Strategies, Implementation, and Applications, Springer, 2019. Crossref, Google Scholar
8. E. J. Hwang, J. G. Nam, W. H. Lim, S. J. Park, Y. S. Jeong, J. H. Kang, E. K. Hong, T. M. Kim, J. M. Goo, S. Park, K. H. Kim, C. M. Park, “Deep Learning for Chest Radiograph Diagnosis in the Emergency Department,” Radiology, vol. 293, no. 3, 2019. Link, Google Scholar
9. M. Annarumma, S. J. Withey, R. J. Bakewell, E. Pesce, V. Goh, G. Montana, “Automated Triaging of Adult Chest Radiographs with Deep Artificial Neural Networks,” Radiology, vol. 291, no. 1, 2019. Link, Google Scholar
10. K. Murphy, S. S. Habib, S. M. A. Zaidi, S. Khowaja, A. Khan, J. Melendez, E. T. Scholten, F. Amad, S. Schalekamp, M. Verhagen, R. H. H. M. Philipsen, A. Meijers, B. v. Ginneken, “Computer aided detection of tuberculosis on chest radiographs: An evaluation of the CAD4TB v6 system,” Scientific Reports, vol. 10, 2020. Crossref, Google Scholar
11. Z. Z. Qin, M. S. Sander, B. Rai, C. N. Titahong, S. Sudrungrot, S. N. Laah, L. M. Adhikari, E. J. Carter, L. Puri, A. J. Codlin, J. Creswell, “Using artificial intelligence to read chest radiographs for tuberculosis detection: A multi-site evaluation of the diagnostic accuracy of three deep learning systems,” Scientific Reports, vol. 9, 2019. Crossref, Google Scholar
12. E. J. Hwang, S. Park, K.-N. Jin, J. I. Kim, S. Y. Choi, J. H. Lee, J. M. Goo, J. Aum, J.-J. Yim, J. G. Cohen, G. R. Ferretti, C. M. Park, “Development and Validation of a Deep Learning–Based Automated Detection Algorithm for Major Thoracic Diseases on Chest Radiographs,” JAMA Network Open, vol. 2, no. 3, 2019. Crossref, Medline, Google Scholar
13. [Online]. Available: https://www.delft.care/cad4covid/. Google Scholar
14. R. H. H. M. Philipsen, P. Maduskar, L. Hogeweg, J. Melendez, C. I. Sánchez, B. v. Ginneken, “Localized Energy-Based Normalization of Medical Images: Application to Chest Radiography,” IEEE Transactions on Medical Imaging, vol. 34, no. 9, 2015. Crossref, Google Scholar
15. O. Ronneberger, P. Fischer, T. Brox, “U-Net: Convolutional Networks for Biomedical Image Segmentation,” in International Conference on Medical Image Computing and Computer-Assisted Intervention, 2015. Crossref, Google Scholar
16. [Online]. Available: kaggle.com/c/rsna-pneumonia-detection-challenge/data. Google Scholar
17. B. Efron, “Nonparametric standard errors and confidence intervals,” Can. J. Stat., vol. 9, pp. 139-158, 1981. Crossref, Google Scholar
18. J. Eng, D. A. Bluemke, “Imaging Publications in the COVID-19 Pandemic: Applying New Research Results to Clinical Practice,” Radiology, 2020. Google Scholar
19. M.-Y. Ng, E. Y. Lee, J. Yang, F. Yang, X. Li, H. Wang, M. M.-s. Lui, C. S.-Y. Lo, B. Leung, P.-L. Khong, C. K.-M. Hui, K.-y. Yuen, M. D. Kuo, “Imaging Profile of the COVID-19 Infection: Radiologic Findings and Literature Review,” Radiology: Cardiothoracic Imaging, vol. 2, no. 1, 2020. Link, Google Scholar
20. H. Y. F. Wong, H. Y. S. Lam, A. H.-T. Fong, S. T. Leung, T. W.-Y. Chin, C. S. Y. Lo, M. M.-S. Lui, J. C. Y. Lee, K. W.-H. Chiu, T. Chung, E. Y. P. Lee, E. Y. F. W. e. al., “Frequency and Distribution of Chest Radiographic Findings in COVID-19 Positive Patients,” Radiology, vol. 27 March, 2020. Google Scholar
21. S. Salehi, A. Abedi1, S. Balakrishnan, A. Gholamrezanezhad, “Coronavirus Disease 2019 (COVID-19): A Systematic Review of Imaging Findings in 919 Patients,” American Journal of Roentgenology, 2020. Crossref, Google Scholar
22. Y. Fang, H. Zhang, J. Xie, M. Lin, L. Ying, P. Pang, W. Ji, “Sensitivity of Chest CT for COVID-19: Comparison to RT-PCR,” Radiology, vol. Feb 19, 2020.
23. [Online]. Available: https://github.com/ieee8023/covid-chestxray-dataset. Google Scholar
Source: RSNA
- Advertisement -


